As California’s median home price set a new high in March and interest rates reached their highest levels in more than two years, the housing affordability outlook for Californians was diminished in the first quarter of 2022, according to the California Association of Realtors (C.A.R.).
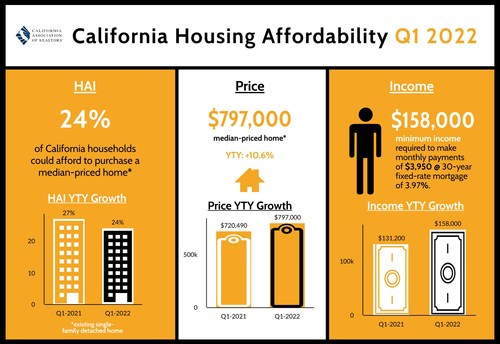
The percentage of home buyers who could afford to purchase a median-priced, existing single-family home in California in first-quarter 2022 ticked down to 24 percent from 25 percent in the fourth quarter of 2021 and was down from 27 percent in the first quarter of 2021, according to C.A.R.’s Traditional Housing Affordability Index (HAI). The first-quarter 2022 figure is less than half of the affordability index peak of 56 percent in the first quarter of 2012.
C.A.R.’s HAI measures the percentage of all households that can afford to purchase a median-priced, single-family home in California. C.A.R. also reports affordability indices for regions and select counties within the state. The index is considered the most fundamental measure of housing well-being for home buyers in the state.
A minimum annual income of $158,000 was needed to qualify for the purchase of a $797,000 statewide median-priced, existing single-family home in the first quarter of 2022. The monthly payment, including taxes and insurance on a 30-year, fixed-rate loan, would be $3,950, assuming a 20 percent down payment and an effective composite interest rate of 3.97 percent. The effective composite interest rate was 3.28 percent in fourth-quarter 2021 and 3.08 percent in first-quarter 2021.
With the median price of condominiums and townhomes reaching another record high in first-quarter 2022, affordability for condos and townhomes dropped from the previous quarter. Thirty-two percent of California households earned the minimum income to qualify for the purchase of a $640,000 median-priced condo/townhome in the first quarter of 2022, which required an annual income of $126,800 to make monthly payments of $3,170. The first quarter 2022 figure was down from 40 percent a year ago.
Compared with California, nearly half of the nation’s households could afford to purchase a $368,200 median-priced home, which required a minimum annual income of $73,200 to make monthly payments of $1,830. Nationwide affordability was down from 54 percent a year ago.
Key points from the first-quarter 2022 Housing Affordability report include:
- Compared to the previous quarter, housing affordability in the first quarter of 2022 declined in all but two of 51 counties. Affordability was improved in Mendocino County and remained unchanged in Humboldt County.
- In the nine-county San Francisco Bay Area, affordability declined from the previous quarter in all counties. Alameda County was the least affordable Bay Area county, at just 17 percent of households able to purchase the $1,370,500 median-priced home. Thirty-seven percent of Solano County households could afford the $600,000 median-priced home, making it the most affordable Bay Area county.
- In the Southern California region, housing affordability deteriorated in all counties. Orange County was the least affordable at 13 percent, while San Bernardino County was the most affordable at 39 percent of households able to purchase the $460,000 median-priced home.
- In the Central Valley region, Kings County was the most affordable at 51 percent, and San Benito was the least affordable at 24 percent.
- In the Central Coast region, Santa Barbara County was the least affordable at 12 percent, and San Luis Obispo County was the most affordable at 18 percent.
- For the state as a whole, Lassen (61 percent) remained the most affordable county in California in the first quarter of 2022, followed by Kings (51 percent), Shasta (42 percent) and Siskiyou (42 percent). Lassen also required the lowest minimum qualifying income ($48,400) of all counties in California to purchase a median-priced home.
- Mono (7 percent), Santa Barbara (12 percent), Santa Cruz (13 percent) and Orange (13 percent) were the least affordable counties in the state, with each of them requiring at least a minimum income of $205,600 to purchase a median-priced home in the county. San Mateo had the highest minimum qualifying income to buy a median-priced home in first-quarter 2022, surpassing the $400,000 benchmark for the first time and reaching a record high at $435,200. Three other counties in California that also had a minimum qualifying income of over $300,000 in first-quarter 2022 were Santa Clara ($371,600), San Francisco ($366,800), and Marin ($329,200).
- Housing affordability declined the most on a year-over-year basis in Yuba, dropping 12 points from the previous year. Four other counties that also recorded double-digit annual drops include Plumas (-11 points), Tuolumne (-11 points), Tehama (-10 points), and Yolo (-10 points). Higher interest rates and home price surges from a year ago were primary factors that led to the drop in affordability in these counties.
|
CALIFORNIA ASSOCIATION OF REALTORS |
||||||||
|
First Quarter 2022 |
C.A.R. Traditional Housing Affordability Index |
|||||||
|
STATE/REGION/COUNTY |
Qtr. 1 2022 |
Qtr. 4 |
Qtr. 1 2021 |
Median |
Monthly |
Minimum |
||
|
Calif. Single-family home |
24 |
25 |
27 |
$797,000 |
$3,950 |
$158,000 |
||
|
Calif. Condo/Townhome |
32 |
36 |
40 |
$640,000 |
$3,170 |
$126,800 |
||
|
Los Angeles Metro Area |
24 |
26 |
29 |
$736,000 |
$3,650 |
$146,000 |
||
|
Inland Empire |
31 |
35 |
39 |
$560,000 |
$2,780 |
$111,200 |
||
|
San Francisco Bay Area |
20 |
23 |
23 |
$1,350,000 |
$6,690 |
$267,600 |
||
|
United States |
47 |
51 |
r |
54 |
$368,200 |
$1,830 |
$73,200 |
|
|
San Francisco Bay Area |
||||||||
|
Alameda |
17 |
20 |
22 |
$1,370,500 |
$6,790 |
$271,600 |
||
|
Contra Costa |
30 |
33 |
32 |
$910,000 |
$4,510 |
$180,400 |
||
|
Marin |
21 |
23 |
22 |
$1,660,000 |
$8,230 |
$329,200 |
||
|
Napa |
20 |
24 |
24 |
$965,000 |
$4,780 |
$191,200 |
||
|
San Francisco |
20 |
21 |
20 |
$1,850,000 |
$9,170 |
$366,800 |
||
|
San Mateo |
18 |
19 |
19 |
$2,195,000 |
$10,880 |
$435,200 |
||
|
Santa Clara |
20 |
22 |
22 |
$1,875,000 |
$9,290 |
$371,600 |
||
|
Solano |
37 |
42 |
44 |
$600,000 |
$2,970 |
$118,800 |
||
|
Sonoma |
23 |
28 |
27 |
$825,000 |
$4,090 |
$163,600 |
||
|
Southern California |
||||||||
|
Los Angeles |
20 |
21 |
24 |
$792,470 |
$3,930 |
$157,200 |
||
|
Orange |
13 |
17 |
20 |
$1,260,000 |
$6,250 |
$250,000 |
||
|
Riverside |
28 |
32 |
36 |
$607,000 |
$3,010 |
$120,400 |
||
|
San Bernardino |
39 |
42 |
45 |
$460,000 |
$2,280 |
$91,200 |
||
|
San Diego |
19 |
23 |
25 |
$905,000 |
$4,490 |
$179,600 |
||
|
Ventura |
21 |
24 |
27 |
$882,070 |
$4,370 |
$174,800 |
||
|
Central Coast |
||||||||
|
Monterey |
16 |
19 |
17 |
$885,000 |
$4,390 |
$175,600 |
||
|
San Luis Obispo |
18 |
22 |
25 |
$852,250 |
$4,220 |
$168,800 |
||
|
Santa Barbara |
12 |
20 |
14 |
$1,130,000 |
$5,600 |
$224,000 |
||
|
Santa Cruz |
13 |
17 |
18 |
$1,425,000 |
$7,060 |
$282,400 |
||
|
Central Valley |
||||||||
|
Fresno |
37 |
40 |
46 |
$405,000 |
$2,010 |
$80,400 |
||
|
Glenn |
36 |
43 |
44 |
$360,000 |
$1,780 |
$71,200 |
||
|
Kern |
38 |
43 |
47 |
$370,000 |
$1,830 |
$73,200 |
||
|
Kings |
51 |
54 |
58 |
$325,000 |
$1,610 |
$64,400 |
||
|
Madera |
38 |
42 |
46 |
$415,000 |
$2,060 |
$82,400 |
||
|
Merced |
40 |
45 |
46 |
$390,000 |
$1,930 |
$77,200 |
||
|
Placer |
34 |
39 |
39 |
$685,000 |
$3,400 |
$136,000 |
||
|
Sacramento |
34 |
39 |
41 |
$545,000 |
$2,700 |
$108,000 |
||
|
San Benito |
24 |
27 |
31 |
$847,500 |
$4,200 |
$168,000 |
||
|
San Joaquin |
34 |
38 |
42 |
$520,000 |
$2,580 |
$103,200 |
||
|
Stanislaus |
36 |
40 |
44 |
$460,000 |
$2,280 |
$91,200 |
||
|
Tulare |
41 |
44 |
47 |
$343,460 |
$1,700 |
$68,000 |
||
|
Far North |
||||||||
|
Butte |
33 |
35 |
37 |
$450,000 |
$2,230 |
$89,200 |
||
|
Lassen |
61 |
63 |
62 |
$245,000 |
$1,210 |
$48,400 |
||
|
Plumas |
36 |
39 |
47 |
$430,000 |
$2,130 |
$85,200 |
||
|
Shasta |
42 |
45 |
48 |
$380,000 |
$1,880 |
$75,200 |
||
|
Siskiyou |
42 |
44 |
49 |
$310,000 |
$1,540 |
$61,600 |
||
|
Tehama |
35 |
40 |
46 |
$355,000 |
$1,760 |
$70,400 |
||
|
Other Calif. Counties |
||||||||
|
Amador |
40 |
43 |
44 |
$425,000 |
$2,110 |
$84,400 |
||
|
Calaveras |
35 |
40 |
41 |
$489,500 |
$2,430 |
$97,200 |
||
|
Del Norte |
32 |
39 |
36 |
$390,000 |
$1,930 |
$77,200 |
||
|
El Dorado |
29 |
37 |
36 |
$706,820 |
$3,500 |
$140,000 |
||
|
Humboldt |
30 |
30 |
39 |
$430,000 |
$2,130 |
$85,200 |
||
|
Lake |
38 |
43 |
46 |
$354,000 |
$1,750 |
$70,000 |
||
|
Mariposa |
29 |
30 |
37 |
$442,500 |
$2,190 |
$87,600 |
||
|
Mendocino |
24 |
22 |
27 |
$503,000 |
$2,490 |
$99,600 |
||
|
Mono |
7 |
13 |
3 |
$1,037,500 |
$5,140 |
$205,600 |
||
|
Nevada |
33 |
37 |
37 |
$550,000 |
$2,730 |
$109,200 |
||
|
Sutter |
39 |
41 |
45 |
$426,000 |
$2,110 |
$84,400 |
||
|
Tuolumne |
38 |
45 |
49 |
$429,500 |
$2,130 |
$85,200 |
||
|
Yolo |
28 |
33 |
38 |
$630,000 |
$3,120 |
$124,800 |
||
|
Yuba |
33 |
36 |
45 |
$430,000 |
$2,130 |
$85,200 |
||
r = revised


