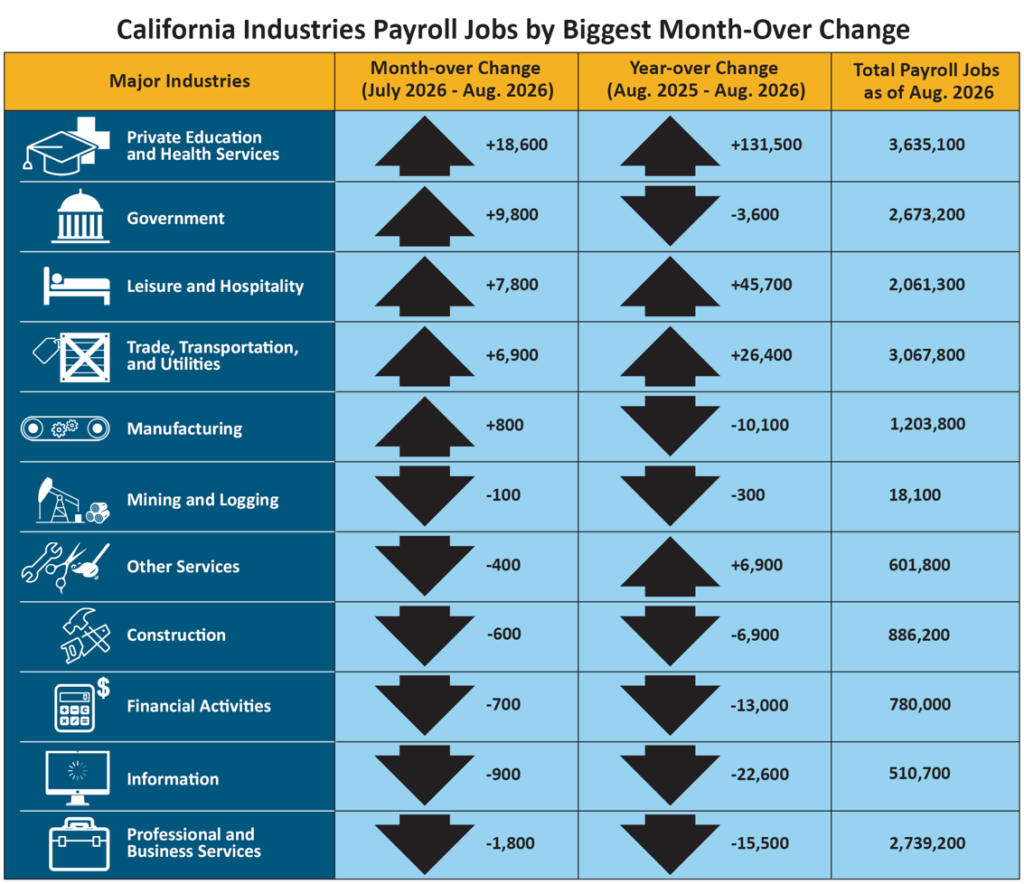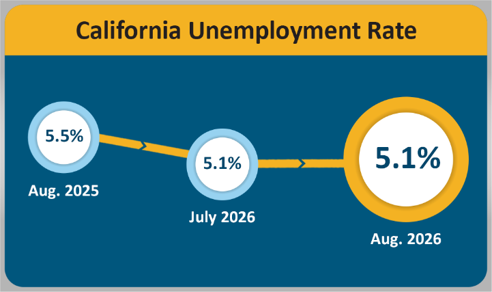
SACRAMENTO — California added 39,400 nonfarm payroll jobs in August while the unemployment rate remained at 5.1 percent according to the latest data from the Employment Development Department (EDD). The rate is down 0.4% from August 2025.
California had 18,177,200 payroll jobs in August, an increase from both July and August 2025. The State had 138,500 more payroll jobs than a year ago. July’s job total was also revised upward by 4,800 jobs, lowering the estimated job loss in July to 15,700.
The August employment data comes from two separate surveys. The payroll survey measures the number of jobs at California businesses. The household survey measures employment and unemployment among Californians.
| County | Labor Force | Employment | Unemployment | Rate |
|---|---|---|---|---|
| STATE TOTAL | 19,491,000 | 18,446,700 | 1,044,300 | 5.4% |
| ALAMEDA | 855,600 | 814,000 | 41,600 | 4.9% |
| ALPINE | 430 | 380 | 40 | 10.4% |
| AMADOR | 15,030 | 14,150 | 880 | 5.8% |
| BUTTE | 89,700 | 84,100 | 5,600 | 6.2% |
| CALAVERAS | 17,570 | 16,460 | 1,110 | 6.3% |
| COLUSA | 11,800 | 10,700 | 1,100 | 9.4% |
| CONTRA COSTA | 574,200 | 545,500 | 28,700 | 5.0% |
| DEL NORTE | 9,310 | 8,710 | 600 | 6.5% |
| EL DORADO | 89,500 | 84,900 | 4,600 | 5.1% |
| FRESNO | 471,900 | 434,900 | 36,900 | 7.8% |
| GLENN | 11,730 | 10,910 | 830 | 7.1% |
| HUMBOLDT | 58,900 | 55,600 | 3,300 | 5.6% |
| IMPERIAL | 76,300 | 59,600 | 16,700 | 21.9% |
| INYO | 8,380 | 7,980 | 400 | 4.7% |
| KERN | 414,000 | 379,300 | 34,800 | 8.4% |
| KINGS | 59,900 | 54,800 | 5,100 | 8.5% |
| LAKE | 26,730 | 24,800 | 1,930 | 7.2% |
| LASSEN | 8,070 | 7,540 | 540 | 6.6% |
| LOS ANGELES | 4,990,400 | 4,743,500 | 247,000 | 4.9% |
| MADERA | 70,400 | 65,200 | 5,200 | 7.4% |
| MARIN | 122,700 | 117,300 | 5,400 | 4.4% |
| MARIPOSA | 7,930 | 7,490 | 440 | 5.6% |
| MENDOCINO | 36,480 | 34,440 | 2,040 | 5.6% |
| MERCED | 121,900 | 111,000 | 10,900 | 8.9% |
| MODOC | 3,110 | 2,920 | 190 | 6.1% |
| MONO | 8,790 | 8,410 | 380 | 4.3% |
| MONTEREY | 228,400 | 215,400 | 13,000 | 5.7% |
| NAPA | 74,000 | 70,800 | 3,200 | 4.3% |
| NEVADA | 47,550 | 45,190 | 2,370 | 5.0% |
| ORANGE | 1,601,900 | 1,530,800 | 71,100 | 4.4% |
| PLACER | 207,500 | 198,100 | 9,400 | 4.5% |
| PLUMAS | 8,080 | 7,620 | 460 | 5.7% |
| RIVERSIDE | 1,183,600 | 1,110,700 | 72,900 | 6.2% |
| SACRAMENTO | 781,600 | 740,300 | 41,300 | 5.3% |
| SAN BENITO | 35,100 | 33,000 | 2,100 | 5.9% |
| SAN BERNARDINO | 1,020,600 | 962,900 | 57,700 | 5.7% |
| SAN DIEGO | 1,640,000 | 1,559,600 | 80,300 | 4.9% |
| SAN FRANCISCO | 499,100 | 478,100 | 21,000 | 4.2% |
| SAN JOAQUIN | 369,700 | 345,600 | 24,200 | 6.5% |
| SAN LUIS OBISPO | 132,300 | 126,100 | 6,200 | 4.7% |
| SAN MATEO | 408,400 | 392,100 | 16,300 | 4.0% |
| SANTA BARBARA | 224,000 | 213,700 | 10,300 | 4.6% |
| SANTA CLARA | 1,034,300 | 990,300 | 44,000 | 4.3% |
| SANTA CRUZ | 139,000 | 131,600 | 7,400 | 5.3% |
| SHASTA | 81,600 | 77,300 | 4,300 | 5.3% |
| SIERRA | 1,560 | 1,490 | 70 | 4.4% |
| SISKIYOU | 16,260 | 15,080 | 1,180 | 7.3% |
| SOLANO | 216,600 | 204,700 | 11,800 | 5.5% |
| SONOMA | 246,000 | 235,000 | 11,000 | 4.5% |
| STANISLAUS | 253,200 | 235,500 | 17,700 | 7.0% |
| SUTTER | 46,200 | 42,800 | 3,400 | 7.4% |
| TEHAMA | 27,390 | 25,710 | 1,690 | 6.2% |
| TRINITY | 5,710 | 5,400 | 310 | 5.5% |
| TULARE | 215,900 | 193,500 | 22,400 | 10.4% |
| TUOLUMNE | 22,050 | 20,810 | 1,240 | 5.6% |
| VENTURA | 414,400 | 393,600 | 20,800 | 5.0% |
| YOLO | 112,300 | 105,900 | 6,400 | 5.7% |
| YUBA | 35,900 | 33,500 | 2,400 | 6.7% |